BACK TO RESEARCH

Using Admissions Lotteries to Validate and Improve School Quality Measures

Research by Joshua Angrist, Parag Pathak, Peter Hull, and Christopher Walters

Measuring School Quality

Parents increasingly rely on data-driven measures of school quality to choose schools, while districts use the same information to guide policy. School quality information often comes in the form of “school report cards” like New York City’s School Quality Snapshot and “school finder” websites, like GreatSchools.org. These school ratings are highly consequential, influencing family enrollment decisions and home prices around the country. State and district restructuring decisions, such as school closures or mergers, also turn on these measures. In short, school performance measures matter.

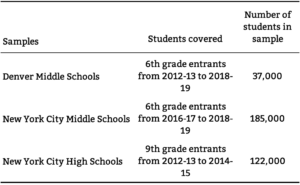
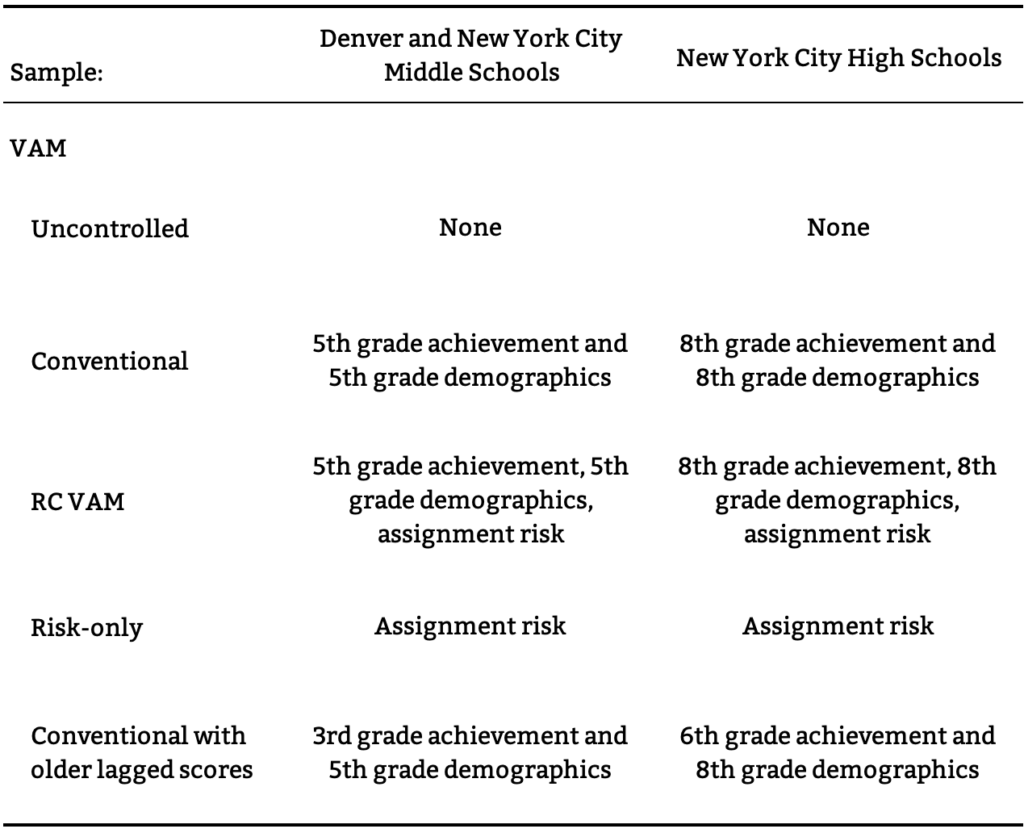
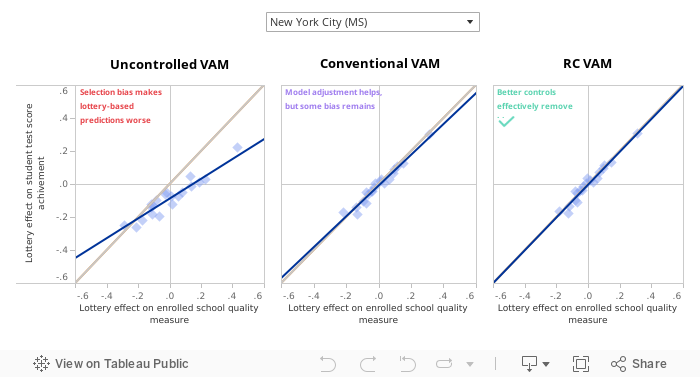
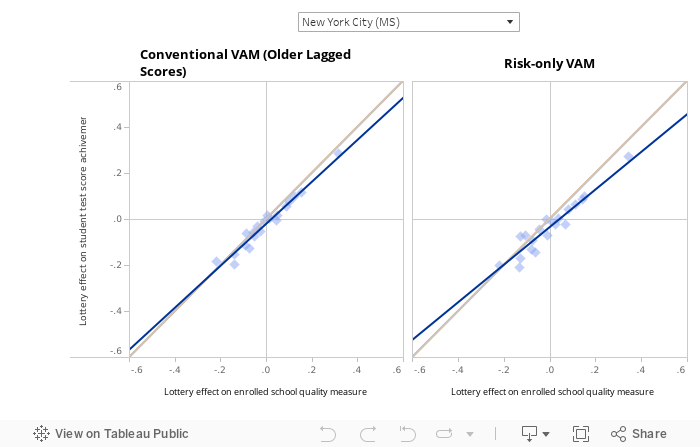
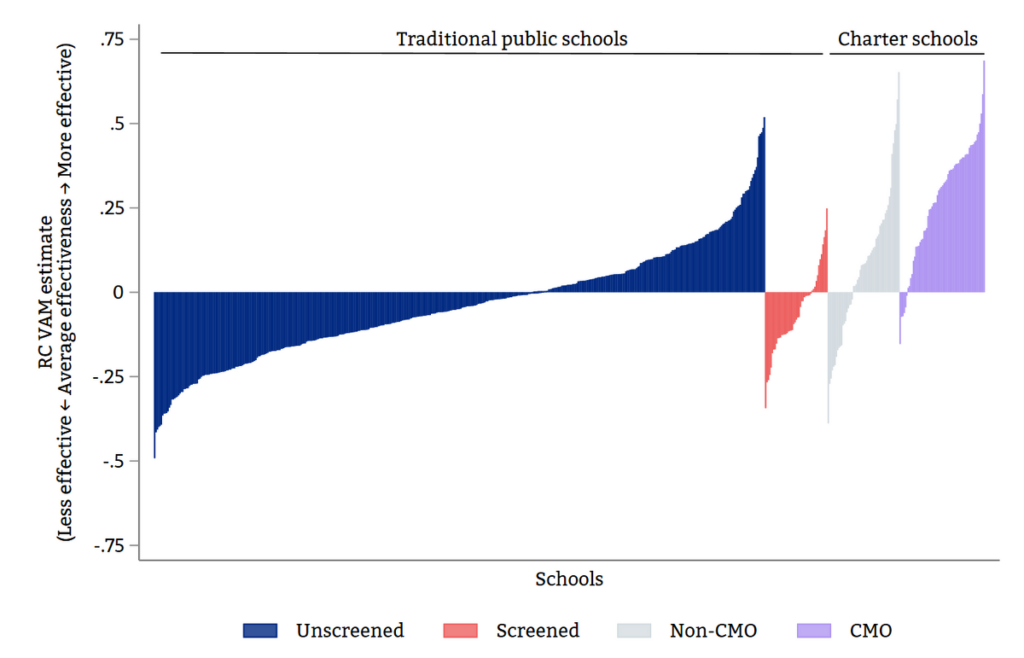
Our study examines the predictive validity of alternative school performance measures to show how they can be improved in districts that use centralized assignment to match students to schools. Using data from New York City and Denver, we show that a new approach that harnesses student data from centralized assignment, which we call a risk controlled value-added model (RC VAM), improves upon conventional methods. We also study a range of other value-added models. In practice, analysts may not have the data required to compute RC VAM and not all districts assign seats centrally. Our study sheds light on approaches that might best serve as performance measures in the absence of ideal data.

The validity of school ratings is important to both policymakers and parents, who rely on them for consequential decisions. Inaccurate measures of school quality can unfairly reward or punish schools erroneously deemed to be more or less effective. For organizations that engage in the provision of quality measures, the methods developed in our study offer a new tool that can provide fairer assessments of school effectiveness.


How do you measure school quality?

One of the most common school performance measures compares average standardized test scores across schools. While this seems natural, such simple comparisons can be misleading. The difference between “high-achieving” and “low-achieving” schools may reflect differences in students’ background or preparation as much or more than the causal impact of a school on student learning. In other words, schools may appear more or less effective because of the types of students they enroll, rather than the quality of their instruction. Researchers refer to this as the problem of selection bias

The figures below illustrate selection bias. Imagine a small district with only two schools, which we label A and B.  Students at school A are high-achievers and score an average of 92 on a standardized math test. Students at school B are lower-achieving, with an average score of only 80. Comparing school A and B, we might conclude that school A is more effective than school B because its students have better outcomes.


Achievement Levels

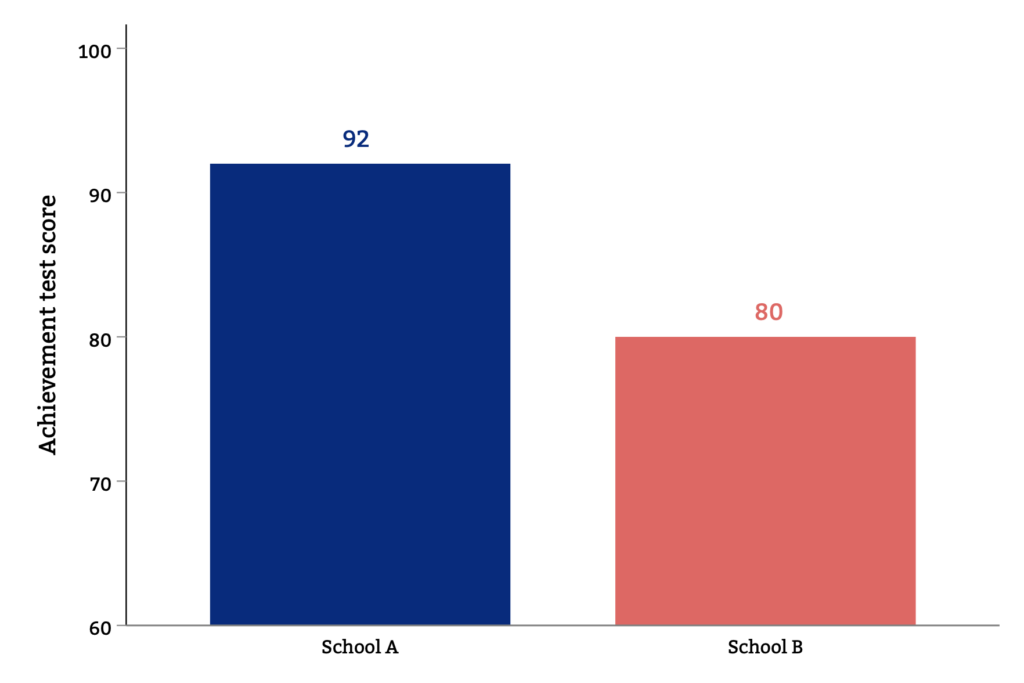
While easy to calculate, simple differences in achievement levels do not necessarily reveal the extent to which schools increase student learning. In practice, high achievement at A might reflect the fact that this school is located in a higher-income neighborhood. Higher-income students tend to have higher test scores, regardless of school quality.  

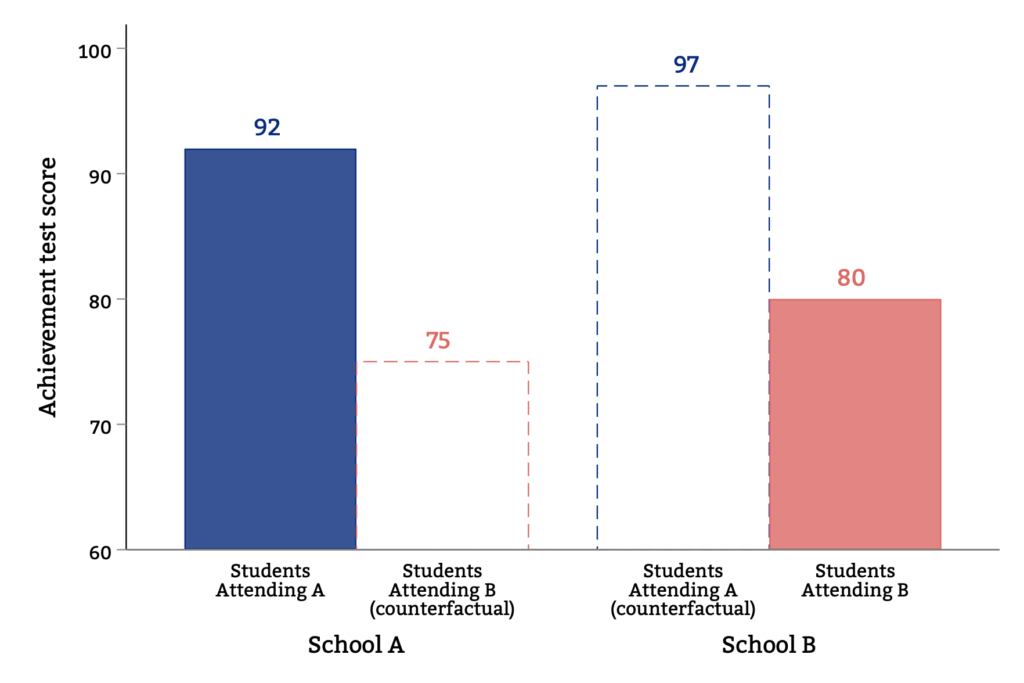
The causal effect of school attendance contrasts achievement for the same students had they attended a different school. Outcomes that we cannot observe for a given student are said to be the counterfactual.

We plot examples of such counterfactuals in the figure below. The figure shows how students attending A would have learned more if they had instead attended B (the dashed blue bar), while the students at school B would have learned less if they had instead attended A (the dashed pink bar). In this example, school B is higher quality than school A— it boosts test scores relative to the counterfactual, whereas school A lowers test scores. This is in spite of the fact that students at A have higher test scores.


Observed and Counterfactual Achievement

We learn about these counterfactual outcomes with the help of more sophisticated analyses designed to capture causal impacts. These tools include value-added models (VAMs) and student growth models. For example, a value-added model might control for students’ achievement in elementary school when measuring middle school quality. Growth models aim to eliminate selection bias by controlling for, or holding constant, differences in student ability. For example, a growth model might control for students’ demographics and baseline achievement to proxy for ability. The hope is that such adjustment moves us closer to a counterfactual-based analysis of school quality, by removing observable differences in student characteristics that might otherwise bias simple comparisons of achievement levels. In practice, however, these adjustments for student characteristics may or may not be adequate. Our study examines the degree to which different modeling approaches indeed capture causal effects.

Research Design

Study Setting

The research uses enrollment and achievement data for middle and high schools in New York City and Denver. New York City data include over 300,000 middle and high school students (from the 2017-2019 and 2013-2015 school years, respectively), and Denver data include over 35,000 middle school students (from the 2013-2019 school years). Our data cover all public schools in these districts (traditional public schools, charter schools, innovation schools, etc.). We focus on math scores as measured by performance on state assessments and on SAT test scores.


Study Samples

Centralized Assignment

The New York City Department of Education and Denver Public Schools both implement a form of school choice that uses a centralized assignment algorithm. These algorithms assign admissions offers on the basis of student preferences, school priorities, and tie-breakers when schools are oversubscribed. Often, the tie-breakers are random numbers, so the algorithm also incorporates an element of random assignment. The “lotteries” generated by random assignments can be thought of as randomized trials. Randomized trials compare groups of people chosen by random assignment. When evaluating the efficacy of a Covid-19 vaccine, for example, researchers randomly divide a sample in half, with one half receiving the vaccine and the other a placebo or inert treatment. This random split ensures vaccine receipt drives any later differences in health between groups. A randomized trial solves the selection bias problem discussed above by directly revealing counterfactuals— researchers can estimate causal effects by comparing the outcomes of randomized treatment and control groups. This research builds on our past work using lotteries and centralized assignment to evaluate school sectors and ratings.

Methodology 

We develop a new methodology, called a risk-controlled value-added model (RC VAM), that aims to estimate the causal impact of schools on student achievement with the same reliability as we’d get from a randomized trial assigning students to different schools. Conventional growth models control or adjust for student demographics and lagged achievement scores. RC VAM makes the same adjustments but also controls for what we call “assignment risk.” These risk controls are a function of students’ preferences and admissions priorities at the schools to which they apply. These are powerful controls because they account for factors such as student ambition (proxied by the schools they apply to) and family background and ability (proxied by sibling and neighborhood priorities, for example). These factors are typically unobserved in standard datasets. We think risk controls account for much if not all of the non-random selection confounding the kinds of comparisons discussed above. Importantly, we note that researchers can estimate RC VAM even for schools that are undersubscribed and when assignment isn’t random. 

Using the lotteries embedded in centralized assignment, we can also test the validity of different school performance measures in New York and Denver. We show that the RC VAM technology provides more credible estimates of school effectiveness than conventional approaches. 

Results

We test the validity of different growth models by asking how a model-predicted effect of going to a school compares to the lottery-predicted effect of going to a school. If the model accurately captures a causal effect, its predictions should coincide with predictions made by the lottery. 

We focus first on three value-added models: uncontrolled, conventional, and RC VAM. The first three rows of the following table detail the controls used in each model.


VAM Controls


The figure below depicts the results of this test for our middle school and high school samples. The vertical axis shows the lottery-predicted effect of going to a school, while the horizontal axis shows the model-predicted effect. Each diamond represents a lottery for a group of schools in the district. Credible VAMs should adhere closely to the dotted 45-degree line.

Predictive Accuracy by Type of VAM

How to read this graph. This figure compares achievement gains (measured in standard deviation units) predicted by school admissions lotteries on the vertical axis to gains predicted by different value-added models on the horizontal axis. For middle school, outcomes are 6th grade math state achievement test scores. For high school, outcomes are math SAT scores.


Uncontrolled VAM estimates are especially misleading: the solid line of best fit diverges substantially from the 45-degree line. This means that admissions offers that lead students to attend schools with high uncontrolled VAM fail to generate commensurate gains in test scores. 

Conventional VAM estimates predict causal effects of school attendance reasonably well — and far better than uncontrolled VAM estimates do. This is visible in the plot showing conventional VAM estimates and predicted lottery impact falling close to the 45 degree line. Conventional controls go a long way towards eliminating selection bias.

While conventional VAM estimates are remarkably accurate, RC VAM improves upon the conventional model. RC VAM aligns almost perfectly with lottery-generated predictions. 

It is worth noting, however,  that in the middle school settings, conventional VAM estimates of effects on 6th grade achievement, computed while controlling for 5th grade achievement, are almost as accurate as the corresponding RC VAM estimates.

 In the high school setting, RC VAM improves markedly on conventional VAM. The lagged score control for SAT outcomes is 8th grade achievement on a state test, which suggests that RC VAM is especially useful when the goal is to estimate school effects on outcomes for which lagged achievement is measured differently and longer ago. Importantly, however, conventional VAM with recent lagged scores remains the next-best alternative to RC VAM in the high school setting. 

Additional Models

Finally, we study two additional models that might be relevant when an analyst does not have access to both conventional and assignment risk controls. First, we test a conventional model that uses older lagged scores. This model corresponds to scenarios in which districts have missing test scores in certain years (a scenario that may be relevant for districts that cancelled tests due to the Covid-19 pandemic). Second, we test a “risk-only” model that controls for assignment risk without conventional controls. This VAM corresponds to scenarios in which an analyst is missing conventional controls entirely (which might arise, for example, in early elementary grades). 

The figure below shows the results for our three samples. The conventional VAM with older lagged scores performs worse than the conventional VAM with recent lagged scores but still eliminates a great deal of selection bias in middle school settings. The risk-only VAM exhibits more bias than the conventional and RC VAM approaches, but similarly reduces bias by a large amount relative to the uncontrolled model. These results suggest that analysts with less-than-ideal data can still construct performance measures that are more aligned with causal effects than by using achievement levels.


Predictive Accuracy of VAMs Using Limited Data

How to read this graph. This figure compares achievement gains (measured in standard deviation units) predicted by school admissions lotteries on the vertical axis versus different value-added models on the horizontal axis. Outcomes are 6th grade math state achievement scores for middle schools and math SAT scores for high schools.


With RC VAM, analysts can credibly estimate school causal effects. The utility of this model is illuminated in a plot of single school estimates in our sample of New York City middle schools. The figure below normalizes RC VAM estimates so that they are mean zero in the district; positive and negative estimates indicate above- and below-average effectiveness. 

Our best estimates of school effectiveness show that there is considerable variation in school effects in the district, with clear patterns across sectors. Screened schools practice selective admissions by admitting high-achieving students, yet many of these schools are below-average in terms of causal effectiveness. Most charter schools are above-average as measured by RC VAM, with charter schools operated under a charter management organization providing especially large gains. Within sectors, it is also clear that the distribution of school quality is not uniform. Each sector has schools that are above- and below-average.


NYC Middle School Math RC VAM Estimates by School Sector

How to read this graph. This figure plots RC VAM estimates for single schools in our sample of New York City middle school students, as one measure of school effectiveness. Outcomes are 6th grade math state achievement scores. Bars with positive values indicate above-average school RC VAM relative to average RC VAM in the district. Bars with negative values indicate below-average RC VAM relative to the average. For example, there are 459 unscreened schools. 288 unscreened schools have RC VAM estimates below average (as shown by bars with negative values) while 171 unscreened schools have RC VAM estimates above average (as shown by bars with positive values). RC VAM estimates are adjusted for estimation error by shrinking estimates towards the mean RC VAM in the district (normalized to be zero) in proportion to the amount of estimation error in the estimate. Screened schools are defined as schools that only offer screened programs. Unscreened schools are all traditional public schools not defined as screened. CMO and non-CMO labels distinguish charter schools that are operated under charter management organizations.


Summary

Families and school leaders rely on accurate performance measures to make good decisions. Poor performance ratings reward schools just because they serve wealthier families. In addition, poorly controlled ratings may lead to bad decisions, like the closure of schools that serve lower-income students and therefore tend to have lower test scores, regardless of school quality. Our research seeks to identify schools that lift a given student’s learning, relative to that student’s counterfactual.  

We show that our new RC VAM method, which leverages school assignment risk in districts using centralized assignment, eliminates selection bias and improves on conventional quality measures. We also show that conventional models are the next-best alternative when assignment risk is not available. In fact, conventional models may perform almost as well as RC VAM in districts with good data on earlier achievements. In settings with less information on earlier achievement outcomes, RC VAM improves accuracy considerably.

More information on the methodology can be found in the following papers:

Joshua Angrist, Peter Hull, Parag Pathak, and Christopher Walters. “Credible School Value-Added with Undersubscribed School Lotteries.” Discussion paper 2021.10 (Cambridge, MA: Blueprint Labs, 2021).

Joshua Angrist, Peter Hull, Parag Pathak, and Christopher Walters. “Leveraging Lotteries for School Value-Added: Testing and Estimation”. Quarterly Journal of Economics 132, no. 2 (2017): 871-919.

Joshua Angrist, Peter Hull, Parag Pathak, and Christopher Walters. “Interpreting Tests of School VAM Validity”. American Economic Review: Papers & Proceedings 106, no. 5 (2016): 388-92.

Research Team

Blueprint Labs is a research lab based in the Massachusetts Institute of Technology (MIT) Department of Economics.

The research was led by Joshua Angrist, Ford Professor of Economics at MIT and co-director of Blueprint Labs; Peter Hull, Groos Family Assistant Professor of Economics at Brown University; Parag Pathak, Class of 1922 Professor of Economics at MIT and co-director of Blueprint Labs; and Christopher Walters, Associate Professor of Economics at University of California, Berkeley.

Jimmy Chin and Raymond Han provided outstanding research assistance, and Blueprint Labs managers Eryn Heying and Anna Vallee provided invaluable support. Talia Gerstle, Jennifer Jackson, and Chetan Patel contributed to web development.

Financial support from Arnold Ventures/LJAF and the National Science Foundation is gratefully acknowledged. This research was carried out under data use agreements between the Denver and New York City public school districts and MIT. We are grateful to these districts for sharing data.